Using visuals to tell data stories
Our blog on data storytelling focused on the value of turning data into engaging content. Using visuals to tell data stories is another powerful tool. Stories with visuals are easier for the brain to absorb and remember. That’s because our brains are hardwired to process images more easily than words alone - 50 percent of our grey matter is dedicated to visual processing.
Think for a moment about the last television news story you watched. You’re more likely to remember it because of the visual content. It’s simply stickier. In a world where millions of pieces of content are created every day, it’s those with visuals that get 94 percent more readership.
So, what kind of visuals can you use to tell sticky data stories?
Here are some ideas to get you started...
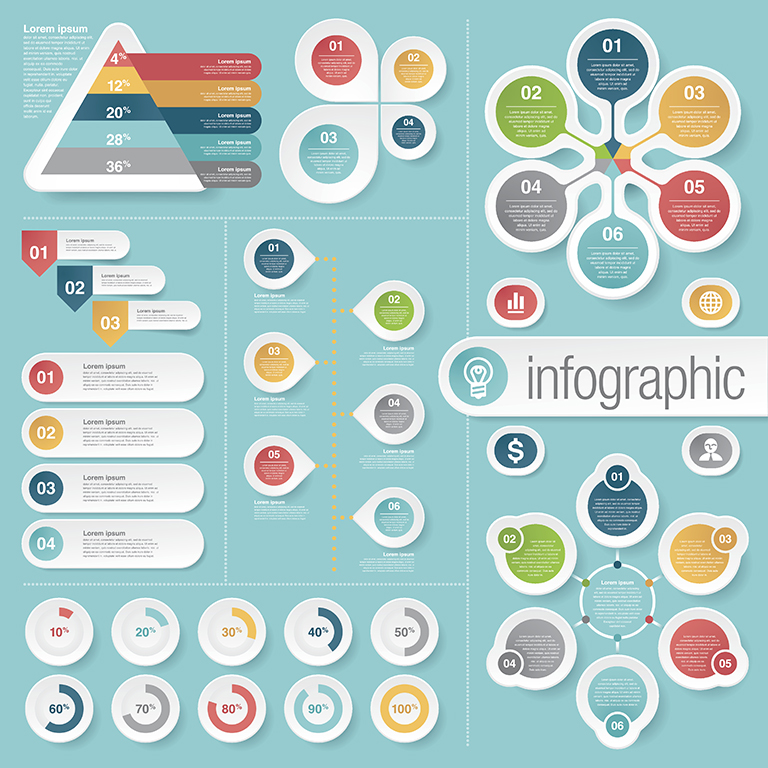
Infographics
An infographic can include visuals and copy; it can tell one story or many. It allows readers to scan and process the information quickly and is shared on social media three times more than any other type of content. Infographics are the gold of data visuals, proffering a pick and mix selection of stories. They’re great for different audiences and a big win with journalists who would rather avoid sifting through pages of data for a story.
Tip: Don’t overcrowd the infographic with too many complicated charts and graphs, remember less is more. Refine the data and design and use copy to callout key trends.
You don’t need to be a large business to produce infographics, check out free online tools to get started.
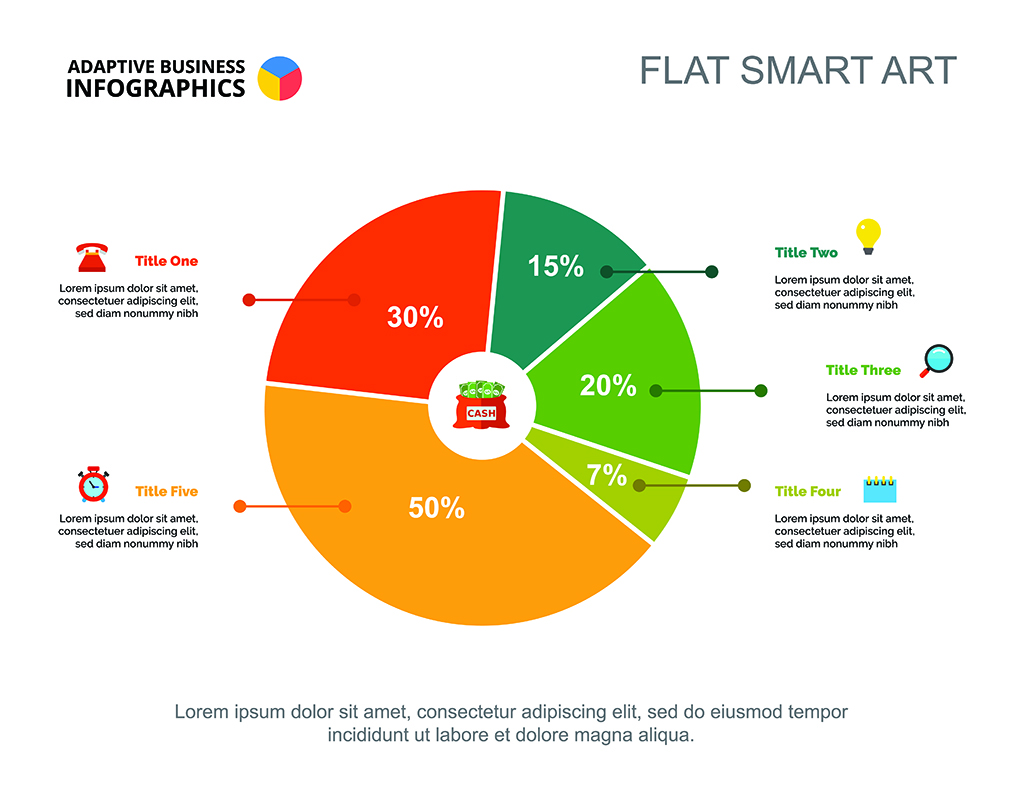
Pie charts
Pie charts are particularly useful for internal data stories; they help take your data from passive to active and guide key business decisions. There’s a reason that these guys are still around; they’re easy to interpret and tell a simple story about how a whole is divided into different parts. Let’s say you’ve been collecting data showing which social media channel your customers prefer. By putting the data into a pie chart, you can distribute it to the decision makers, so they can make more informed decisions about marketing, strategy and lead generation.
Tip: A pie chart works best for categorical data or if you want to easily see the composition of something. Don’t include too many categories as your pie chart will have too many slices, making it difficult to read.
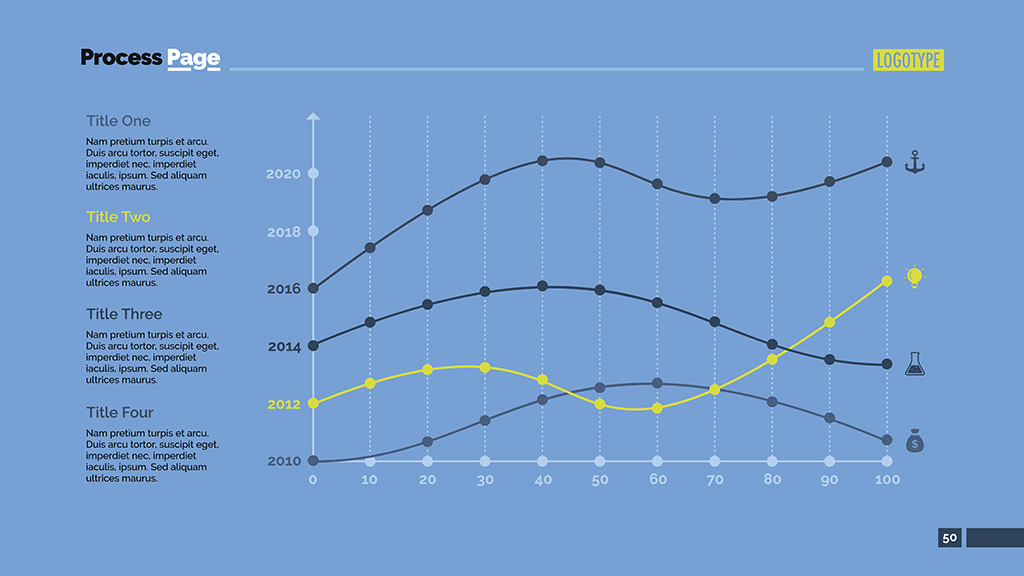
Line graphs
Line graphs are good for telling stories about how numbers have changed over time. Let’s take property purchases as an example. A simple line graph can take turn data points into a story showing how many properties have been purchased nationwide by year or quarter. Whilst it’s only part of the story, the line and its direction tell a high-level story. The same graph could include two more lines showing the number of apartments purchased vs the number of houses.
Tip: A simple line graph is a great tool for social media if you’re looking to generate media interest as it hooks the reader and often prompts a call for more information. You can also present more detail in follow on posts.
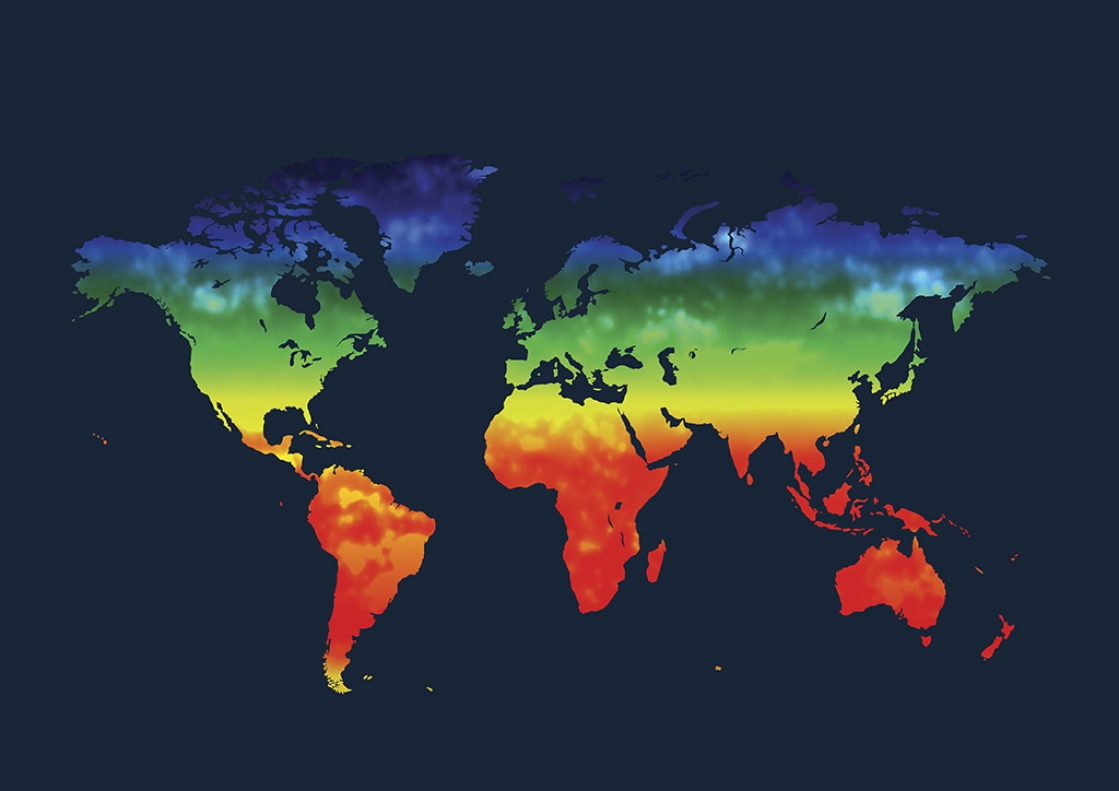
Heatmaps
Using the property example above, you could use a location heatmap to as a storytelling tool. A heatmap is a two dimensional visual that uses colour to tell a story. If you wanted to show where the hotspots are in terms of property purchases in any given year, a heatmap allows immediate recognition. Think colour clusters on a map vs pages of copy with statistical information, and you immediately see the benefits. Take it one step further and add information that pops up as you roll your mouse over colour clusters in the map.
Tip: You don’t need to be a data scientist to create a heatmap, check out free and user-friendly tools online.

If you’re new to creating visuals that tell data stories or don’t have the help of a data expert, make sure there’s a checking process in place before using it internally or externally. Keep it simple and make sure you’re choosing the best visual for your data.
Only use visuals to tell data stories that are engaging. Whilst it’s a different way to tell stories, it still needs to have a good hook.
Ready to employ visual storytelling in your business?
Talk to one of our Data-driven Marketing specialists today about how we can help grow your business - click here to contact us.